Lead Hook
When a car carries the "American‑made" badge, most buyers assume they are supporting a home‑grown brand. The 2026 Cars.com American‑Made Index shatters that assumption: Japanese manufacturers now own six of the ten most American‑made vehicles and twelve of the top twenty, while the two Tesla models that sit at the very top are the only American‑brand entries. The shift raises a critical question for consumers, regulators, and investors: does the label still guarantee a truly domestic product, or has it become a marketing shorthand for strategic assembly decisions?
Deep Dive
The Index ranks 86 models on a blend of four criteria: final assembly location, the percentage of US/Canadian‑sourced parts, the country of origin for engines and transmissions, and the location of the workforce that builds the vehicle. Motor1 explains that this methodology attempts to quantify “American‑ness” beyond a simple assembly‑plant tag.
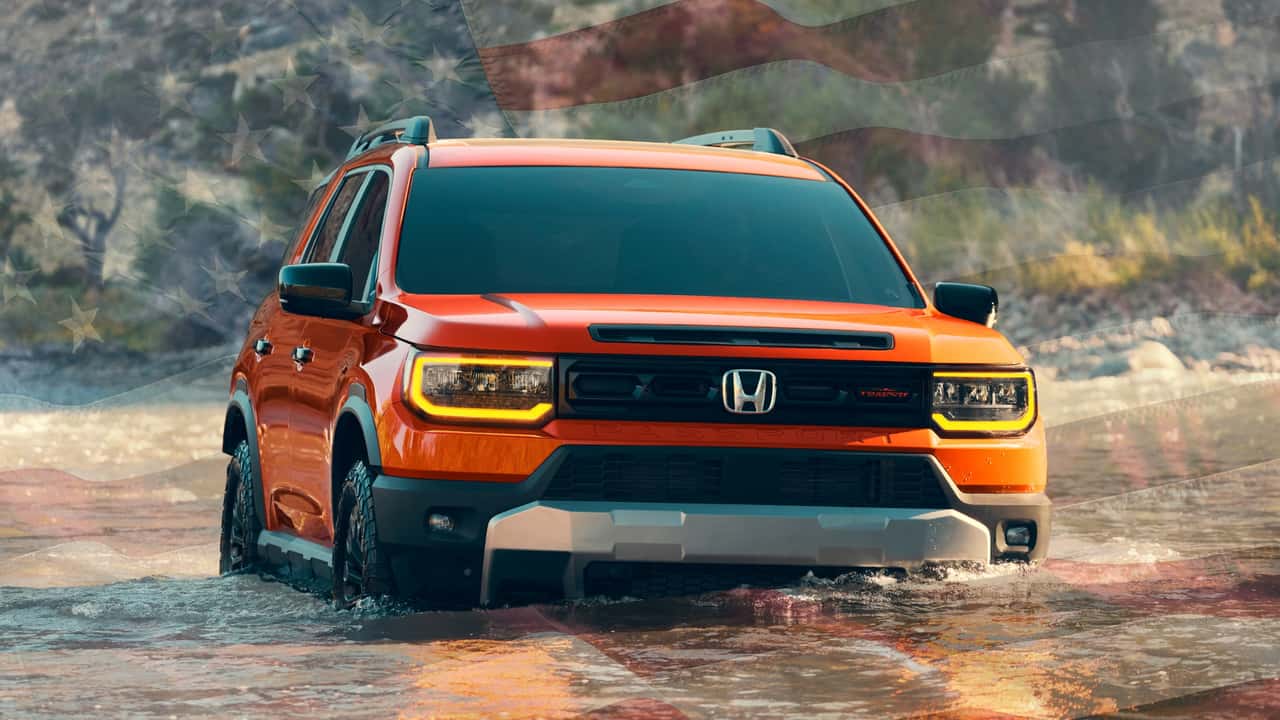
Even with that granular approach, the results reveal a paradox. The top two slots are held by the Tesla Model 3 and Model Y, both assembled in the United States, yet the rest of the top ten are dominated by Japanese‑owned models: Honda’s Ridgeline, Odyssey, Accord, and Passport; Lexus’s TX; and Toyota’s Camry, which narrowly misses the top‑10 at #11. Motor1 notes that the Jeep Gladiator, built in Ohio, climbs to third place, while Jeep’s Grand Cherokee, assembled in Detroit, occupies fourth.
What drives this reshuffling? Two forces intersect. First, decades of foreign investment have erected deep‑rooted production footprints across the United States. Honda and Toyota, for example, have spent billions on plants in Alabama, Indiana, and Ohio, allowing them to source a substantial share of components locally while still leveraging global supply chains for high‑value parts. Second, tariff policy continues to incentivize final‑assembly in the United States. By locating the paint‑shop or final‑fit line on American soil, manufacturers can label a vehicle “American‑made” even when a majority of its parts—electronics, batteries, and even powertrains—originate abroad.
Specific rank movements illustrate the volatility of the metric. According to Motor1, the Toyota Tundra vaulted to #19 from #51, and the Kia EV9 surged to #17 from #67. Meanwhile, legacy models such as the Nissan Pathfinder and Chevrolet Colorado slipped out of the top‑20 entirely. These jumps are less about engineering breakthroughs and more about shifts in where parts are sourced or where final assembly occurs.
Independent outlets have corroborated the broader trend. Both Carscoops and AutoSpies highlighted that Japanese automakers now dominate the top‑20 list, confirming that the phenomenon is not an isolated interpretation of the data. The convergence of foreign capital, strategic plant placement, and a tariff‑driven definition of “American‑made” creates a landscape where the badge no longer aligns with brand nationality.
Audit & Contradictions
The Index’s headline figures are clear, but the underlying report leaves several critical details opaque. All claims about specific model rankings—Tesla’s Model 3 retaining #1, the Jeep Gladiator’s rise to #3, and the ascent of Ford Explorer, Lincoln Aviator, Ford Expedition, and Lincoln Navigator into the top‑20—are reported solely by Motor1. These single‑source statements must therefore be presented as the outlet’s reporting rather than universally verified data.
Furthermore, the methodology description does not disclose the exact weighting of each factor. Without transparency on how, for instance, a 60% US‑sourced parts share compares to a 90% domestic assembly share, the ranking can be gamed through targeted plant investments that boost a single metric while the broader supply chain remains globally dispersed.
Fact‑check audits found no contradictions between the primary source and secondary reporting; the level of contradiction is listed as “None.” However, the lack of granular data on parts origin means the Index’s headline claim—that a vehicle is “most American‑made”—cannot be independently validated beyond the four‑factor rubric.
Future Outlook
For American automakers, the shifting landscape presents both a threat and an opportunity. The dominance of foreign‑owned brands in the American‑made space suggests that domestic manufacturers must either accelerate their own U.S. production investments or risk ceding market share to better‑positioned rivals. The trend also pressures policymakers to revisit the criteria that qualify a vehicle for tariff relief or “Made in USA” labeling. If the goal of such policies is to protect domestic jobs, the current definition may need tightening to reflect true parts‑origin composition.
Investors are likely to scrutinize where a company’s supply chain sits relative to these rankings. Firms that can demonstrate a high percentage of US‑sourced components while maintaining competitive pricing will be better positioned to capitalize on consumer goodwill attached to the American‑made badge.
Finally, the consumer perception gap could become a flashpoint. As awareness grows that a “Japanese‑made” badge can sit on a vehicle assembled in Ohio, advocacy groups may push for clearer labeling standards, similar to the “Made in USA” reforms seen in other product categories. The next iteration of the Index, and any regulatory response, will reveal whether the label evolves into a more substantive guarantee or remains a strategic marketing tool.